


How It Works
Vendor Reports plugin allows vendor to obtain sales information. This is very helpful tool for vendor to conclusions about the status of vendor store.
FEATURES
- Quick and easy in installation.
- Fully information report including chart view and table view.
- Smart division into different types of report
- Many type of chart is supported
- Low stock product reports
- Best seller product reports.
HOW TO USE
After installing Vendor Report, your seller can see a new menu in their seller dashboard, which names “Report”, is created on their side-bar navigation. From there they can start reviewing the business report including selling report and product report.
- 1) Sales report
In the menu Report, we have 2 sub-menus: Sales and Product. Sales report is divided into 4 types: Overview about sales, Sales by Month of Year, by Day of Week and by Hour. Each of them provides different information to sellers, that purposes to deliver the most informative view about their business situation.
- a) Overview
Below here is how the system shows to sellers the overview about sales:
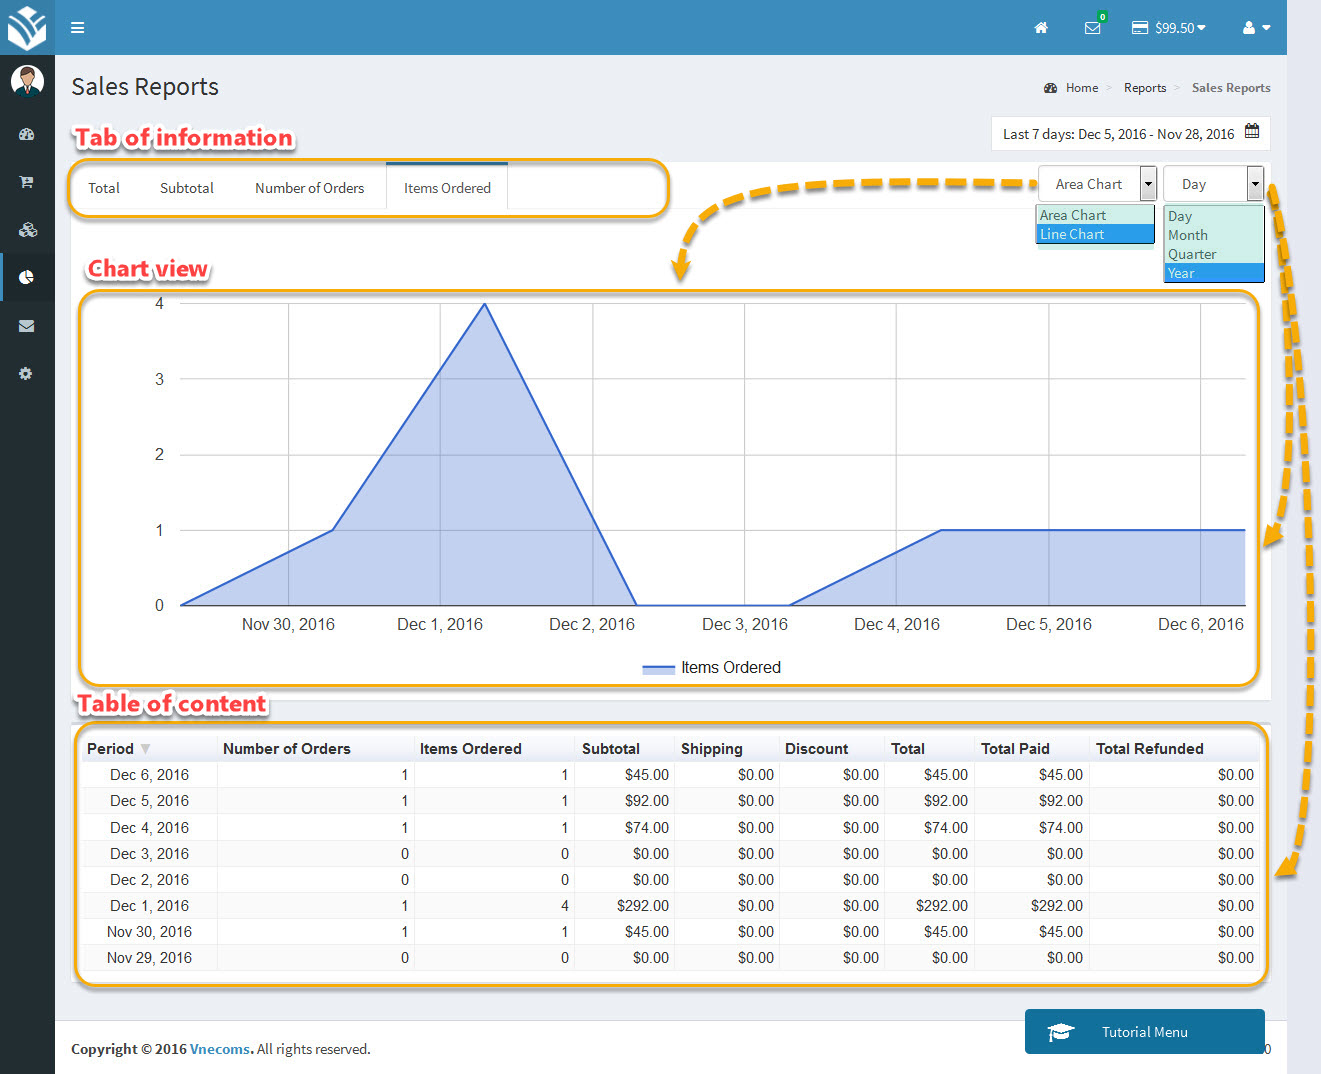
You can find there’re 4 tabs of information including: • Total: Viewing total amount of orders follows by time. • Subtotal: Viewing the total amount of orders without tax, shipping fee or discount follows by time. • Number of orders: Showing the average quantity of orders in a specific time. • Item ordered: Showing the average quantity of ordered items in a specific time. For viewing, the screen is divided into 2 parts: chart view in the top part and table content is in low part. Both of them are adjustable to view by different periods of time (by day, by month, by quarter or by year), especially the chart view can be switched between Area chart and Line chart.
- b) Sales by Months of Year
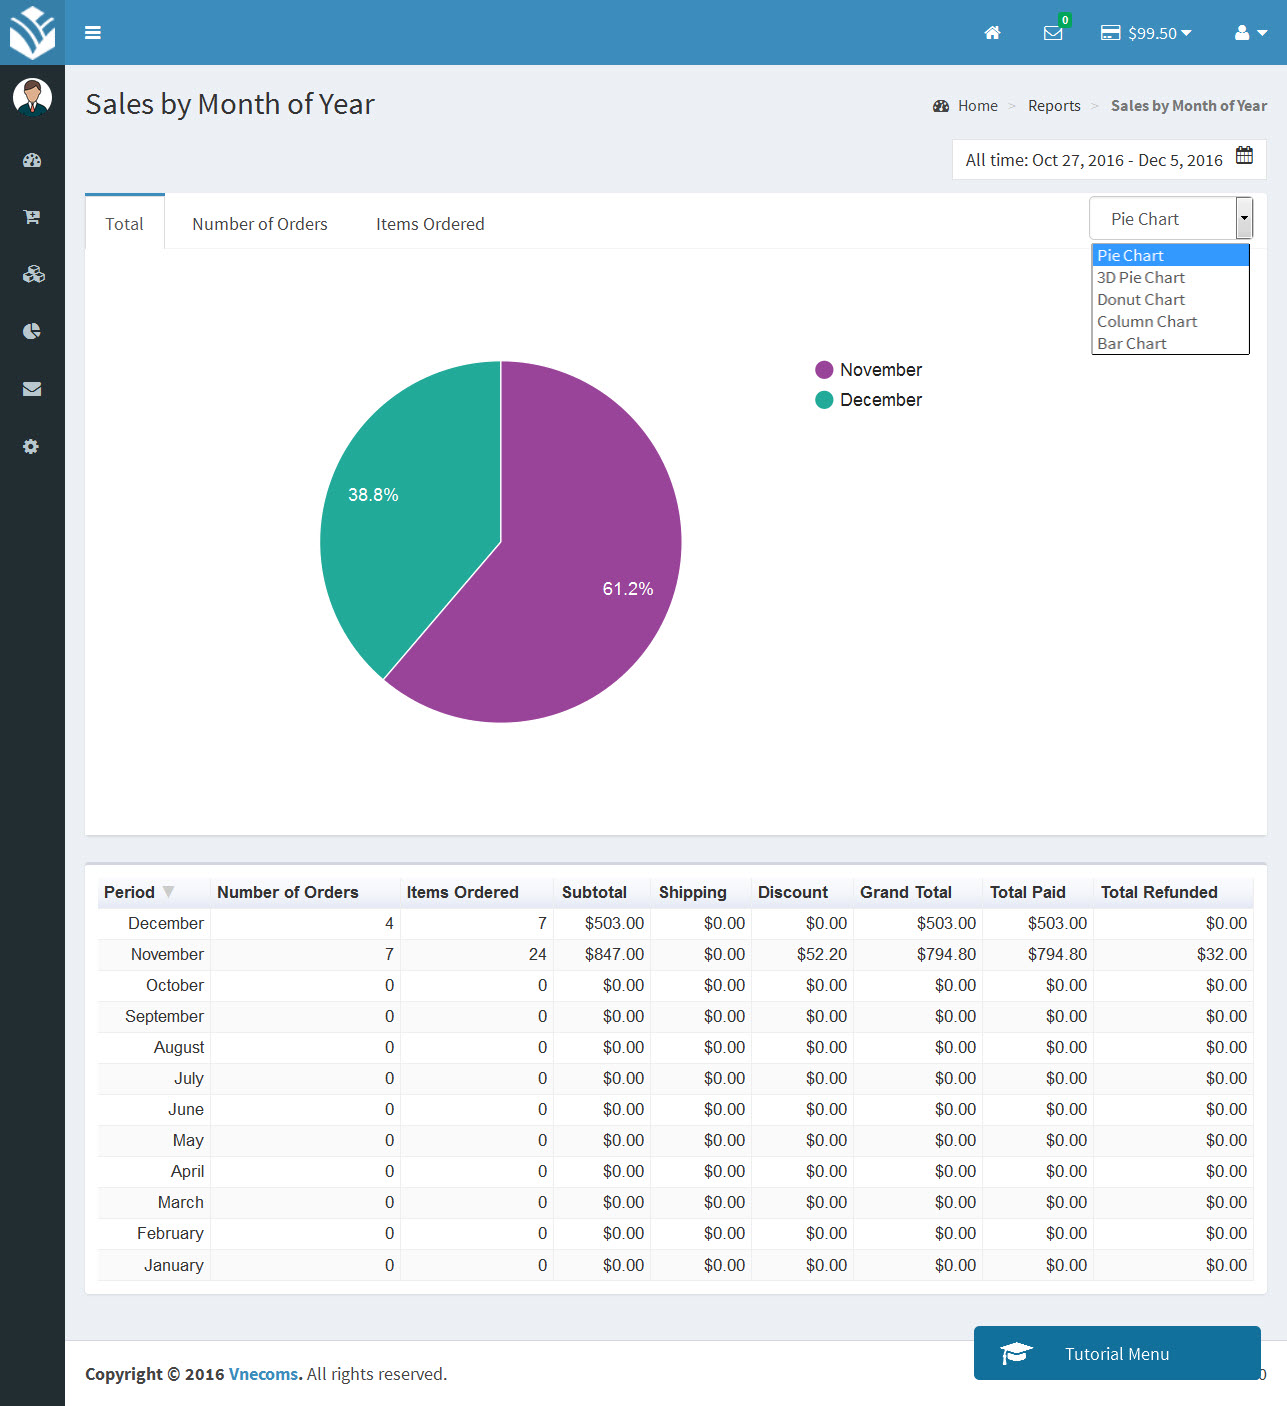
This report tell the sellers the shares of sales, the shares of orders quantities and the shares of ordered items between 12 months of year, it helps seller can easily sort out which months is better for business than the rest of year, so vendor can adjust their business strategy.
- c) Sales by Days of Week
Same with Sales by Months of Year, Sales by Days of Week will help the vendor sorting out which day of week has better business result, so vendor can prepare better for a busy day.
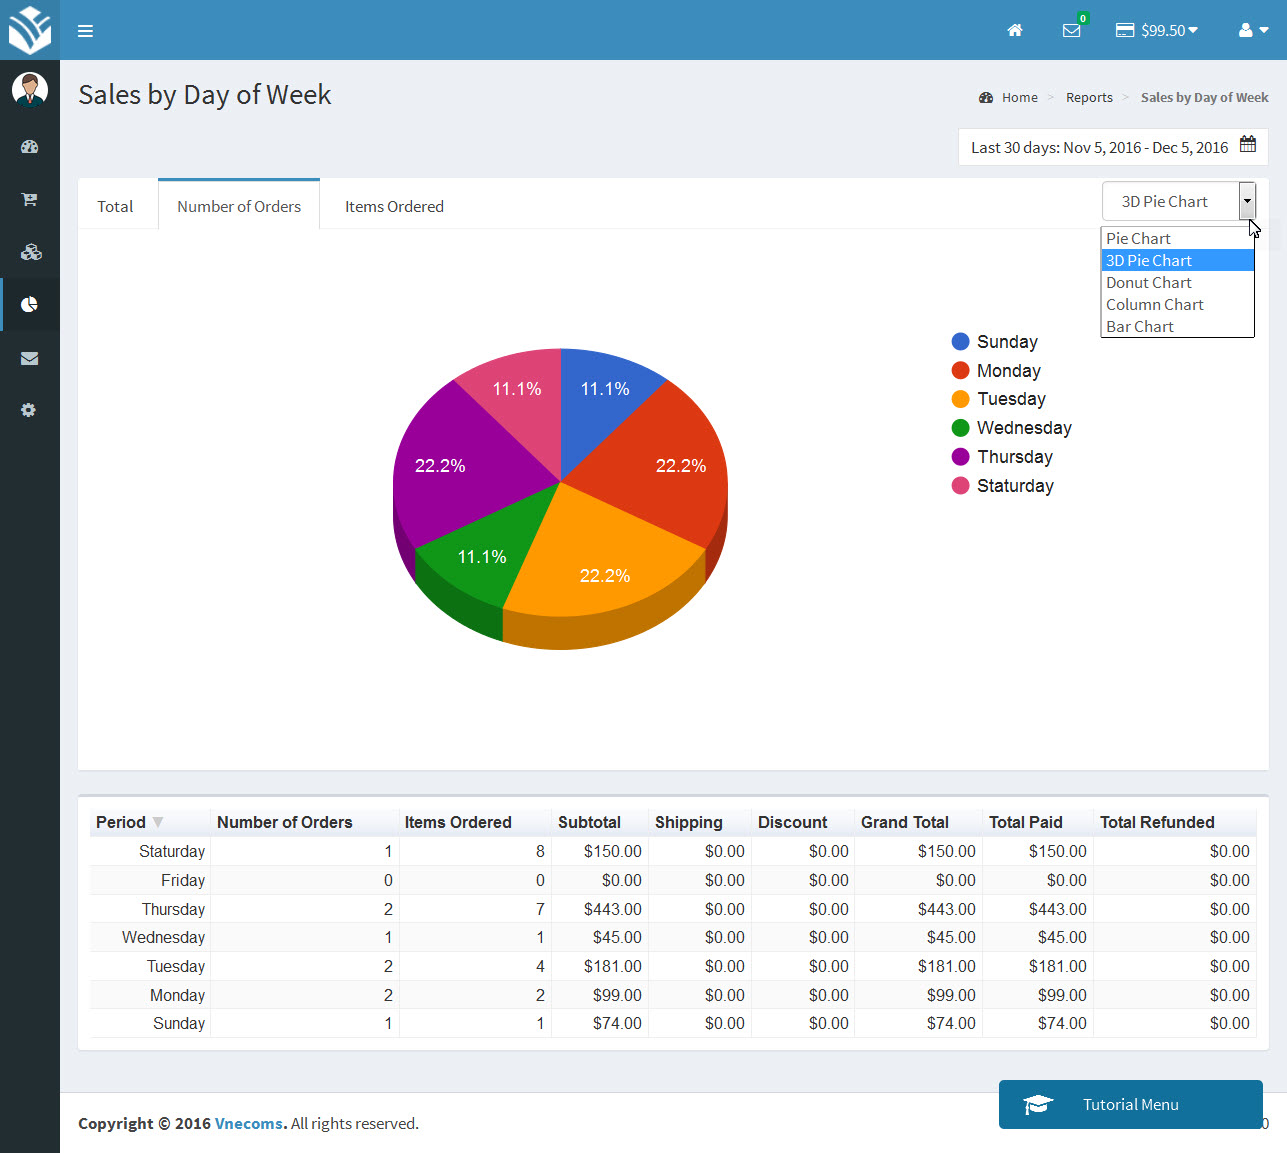
There are 5 types of chart are supported: Pie chart, 3D Pie chart, Donut chart, Column chart and Bar chart. Vendor can choose one depend on their favourite chart.
- d) Sales by Hours
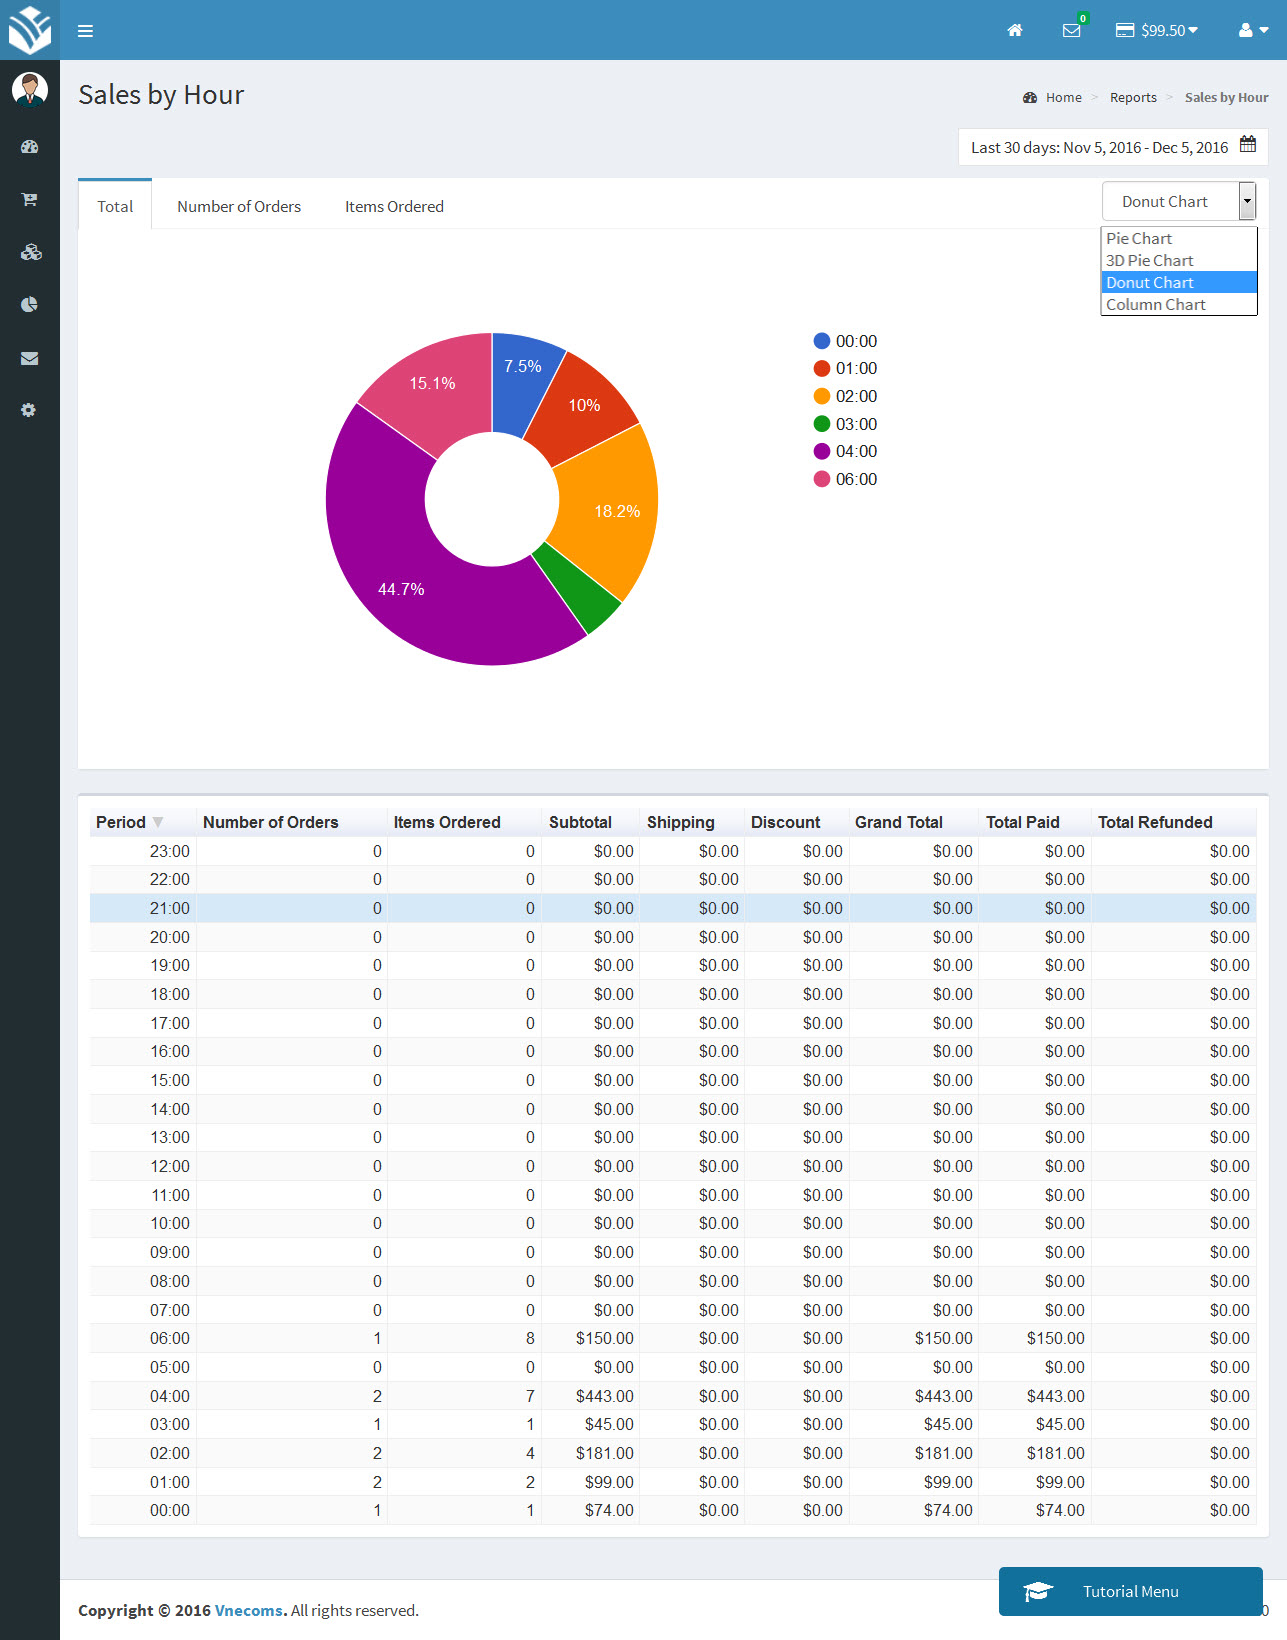
In 24hours of day, there’re always have some hours, at that people likely buy something (for example the best time for buying food is in morning or evening) so at which hours people like to go shopping your product? Report sales by Hours will help the vendor to find the answer by analysing the business result including total amount of orders, number of orders and ordered items in every hours of a day and making a chart and a table for vendor. From that vendor can have a better look about the customer’s behaviour and adjust the time for a happy hour promotion or up selling.
- a) Overview
- 2. Product report
- a) Ordered Product
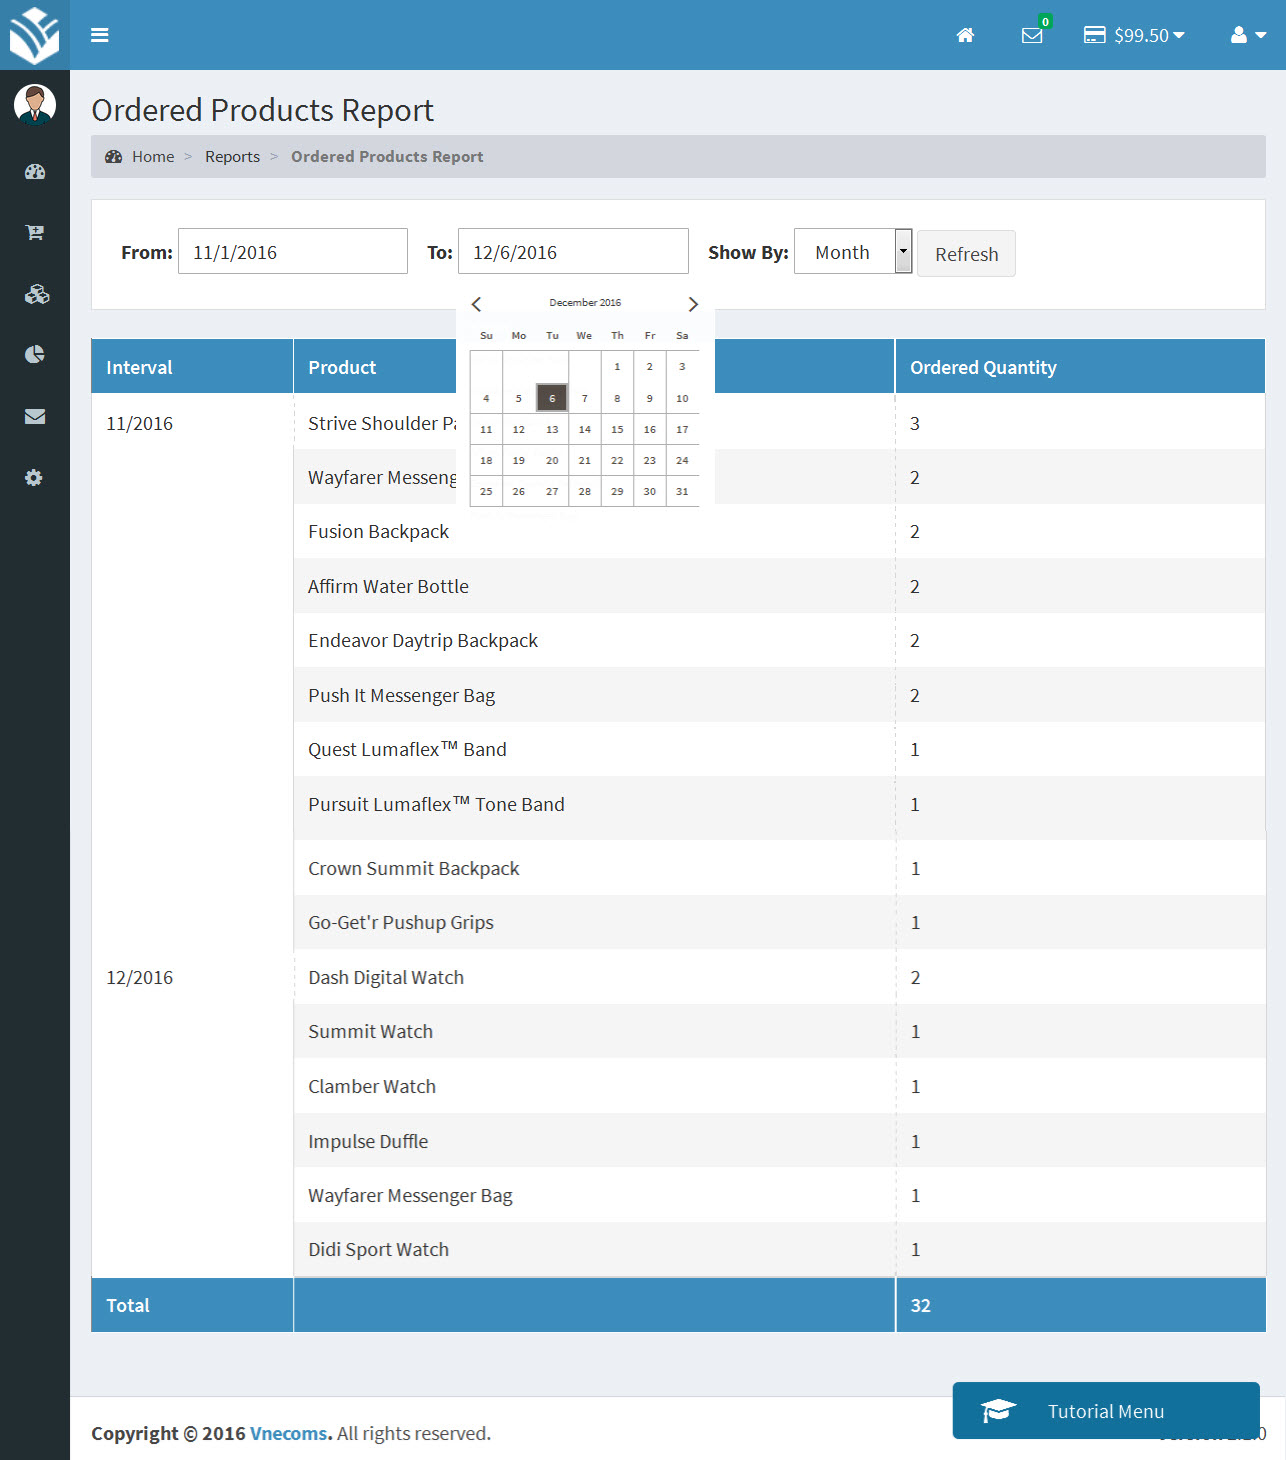
Product report is divided into 2 types: report ordered product and report low stock product. After uploading product and sell, vendor will like to know what product is the most wanted product on their store and what product is sold on a specific time (by day, by month, or by year). Report ordered product is a tool made for that job. Vendor just need to choose how they want the report to show (by day, by month or by year) and range of time and the system will sort out a list of product with quantities which is sold at that range of time.
- b) Low stock product
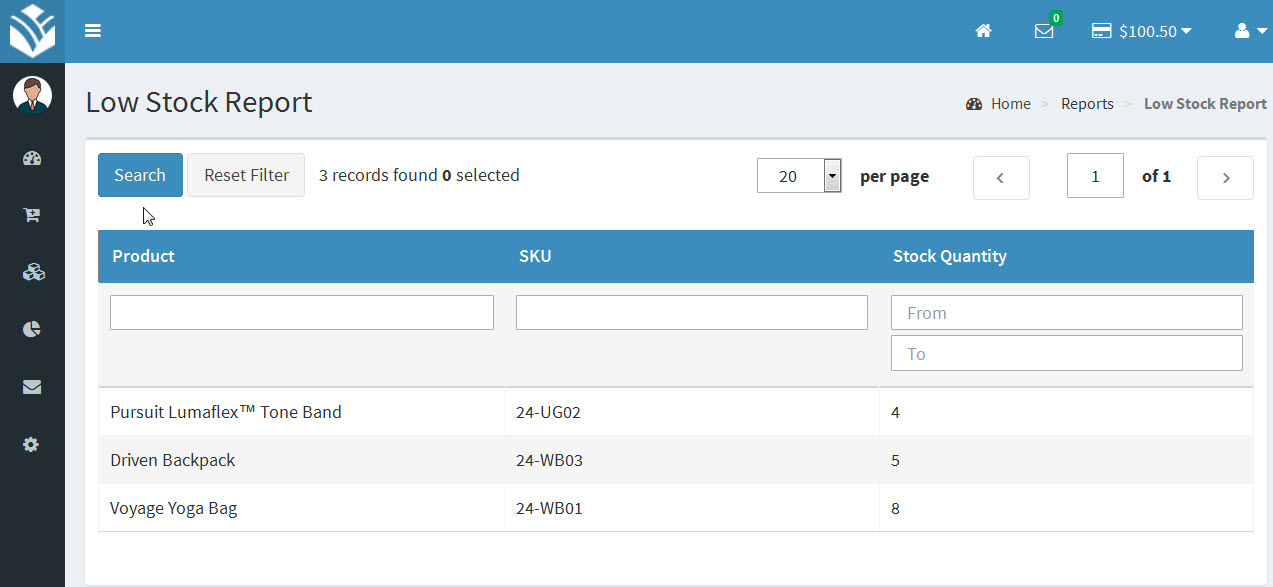
This is a report of low stock products, which have stock number is lower than a specific number configured in admin configuration. It helps vendor can prepare their warehouse for low stock product.
- a) Ordered Product

